Power Apps – Horizontal Bar Chart
9 steps
Introduction:
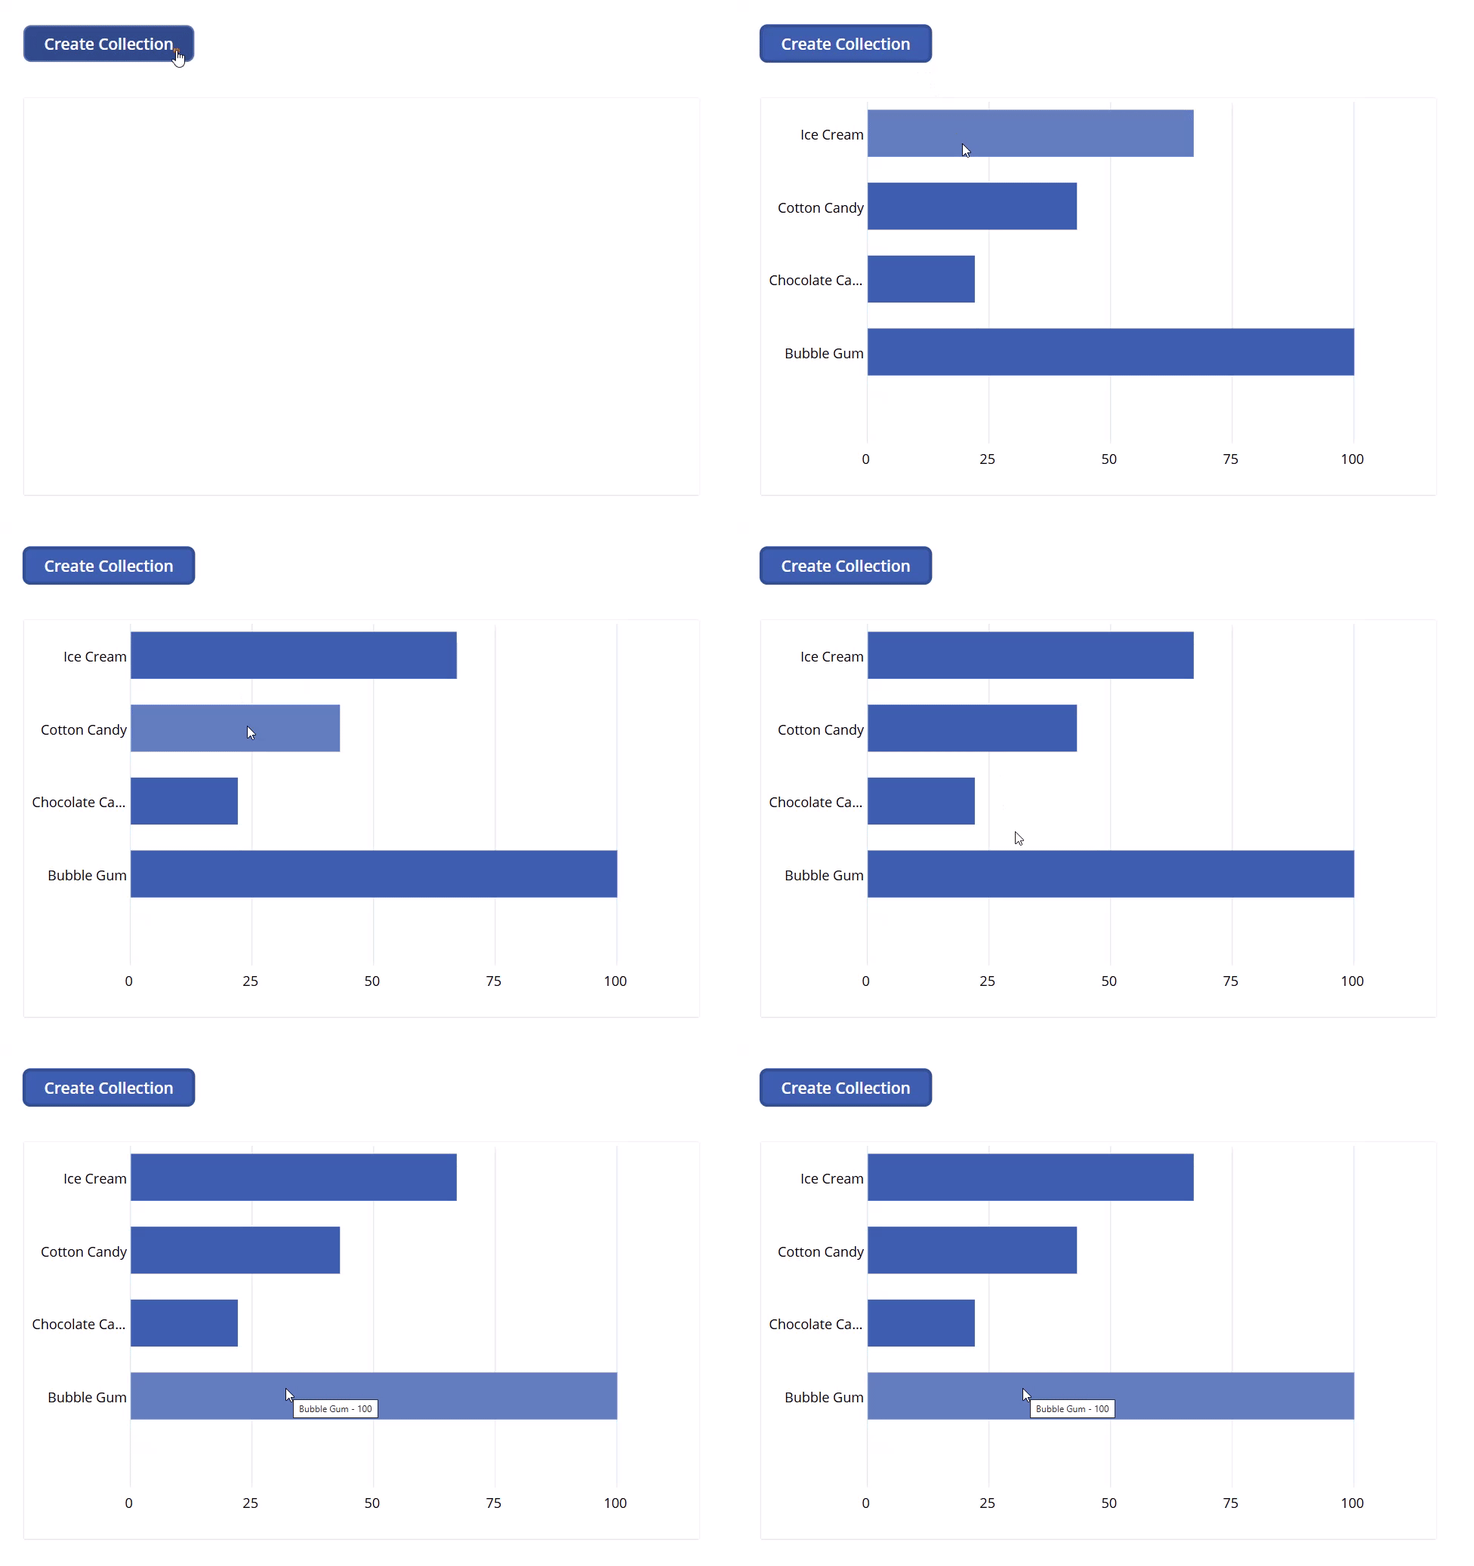
This step-by-step tutorial will guide you on making a simple horizontal bar chart from collection data using out-of-the-box controls in Power Apps. The built-in column chart in Power Apps is only available in vertical layout. Power BI is not needed.
Step 1:
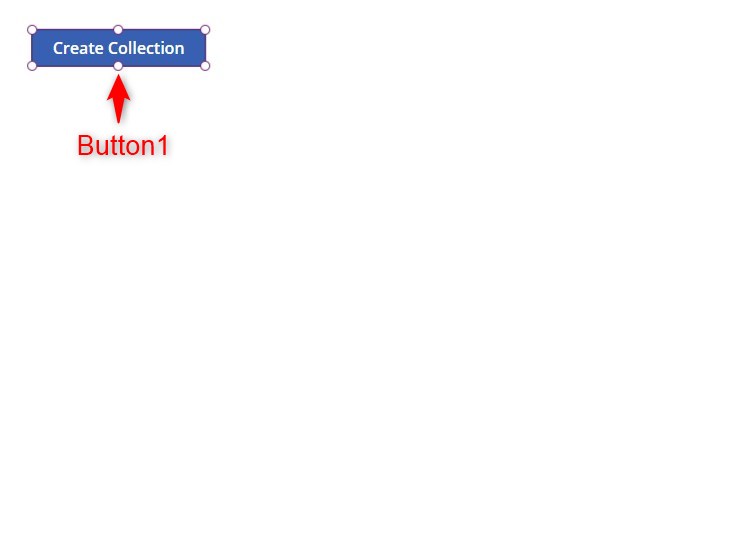
Insert a button named Button1. Change the following properties:
Text property
"Create Collection"OnSelect property
ClearCollect(collMyCollection,
Table(
{Title:"Ice Cream",Count:67},
{Title:"Cotton Candy",Count:43},
{Title:"Chocolate Cakes",Count:22},
{Title:"Bubble Gum",Count:100})
)
;

/*
Change the count of varGraphSectionCount
if you want more dividing lines in the graph,
but you will have to adjust the width of Gallery2 and Rectangle1
*/
With({varGraphSectionCount:5},
Clear(collGraphSections);
ForAll(Sequence(varGraphSectionCount),
Collect(collGraphSections,
{
Value:If(IsEmpty(collGraphSections),
0,
Max(collGraphSections,Value) +
(Max(collMyCollection,Count)/(varGraphSectionCount-1)))
}
))
);

Notify("Collection has been created!");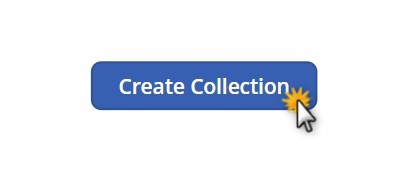
Step 2:
Activate play mode and click the ‘Create Collection’ button so that our collection gets created.
Step 3:
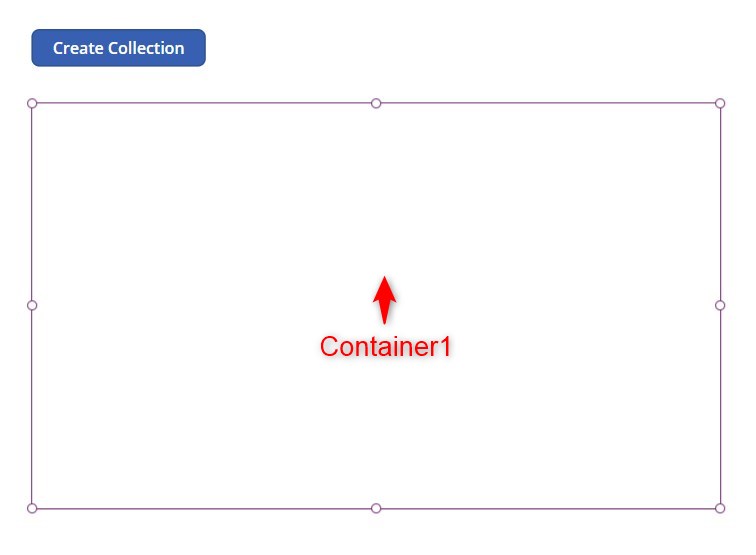
Insert a container named Container1. Change the following properties:
Width property
860Height property
506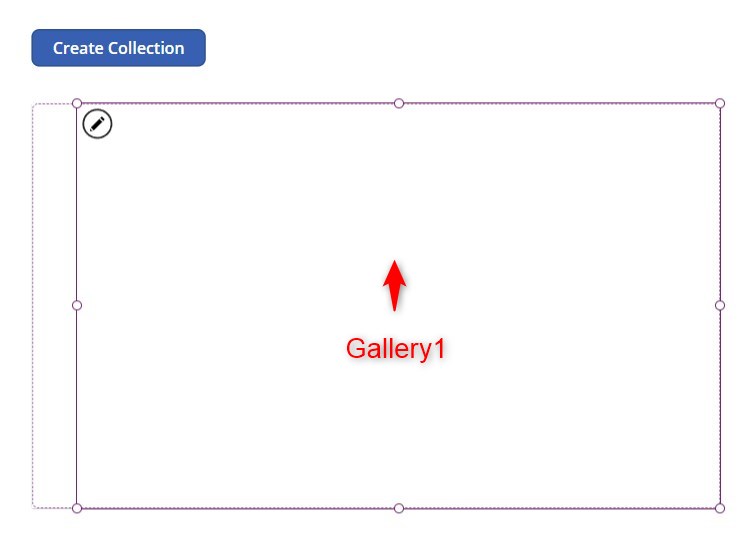
Step 4:
Insert a blank horizontal gallery named Gallery1 inside Container1. Change the following properties:
X property
56Y property
0Width property
Container1.Width - Self.XHeight property
Container1.HeightTemplateSize property
CountRows(collGraphSections) * 30Items property
collGraphSections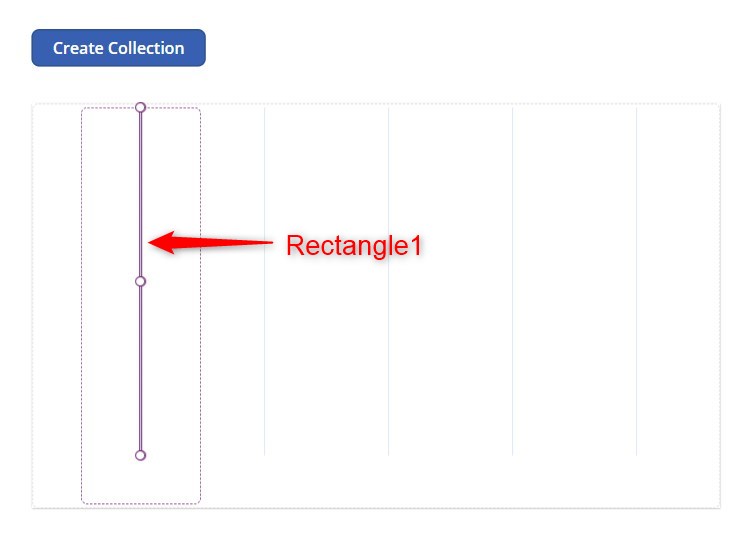
Step 5:
Insert a rectangle named Rectangle1 inside Gallery1. Change the following properties:
X property
Parent.TemplateWidth/2 - Self.Width/2Y property
0Width property
1Height property
435Fill property
RGBA(204, 231, 246, 1)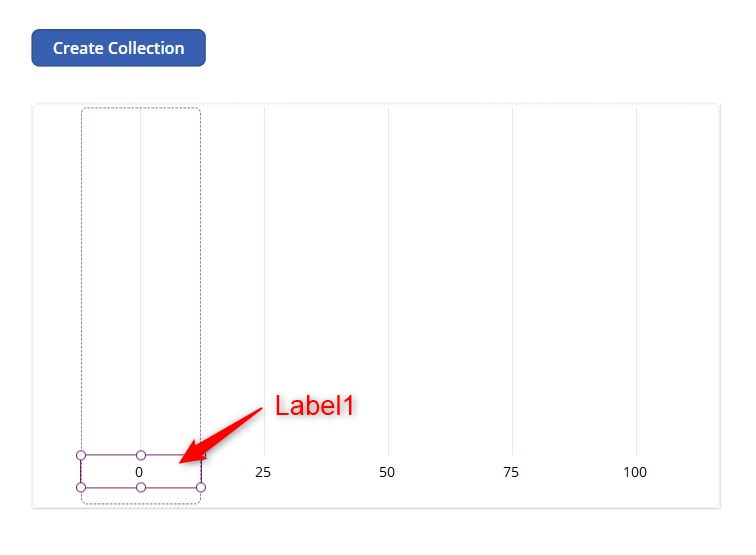
Step 6:
Insert a text label named Label1 inside Gallery1. Change the following properties:
X property
0Y property
435Width property
Parent.TemplateWidthHeight property
40Text property
ThisItem.ValueAlign property
Align.Center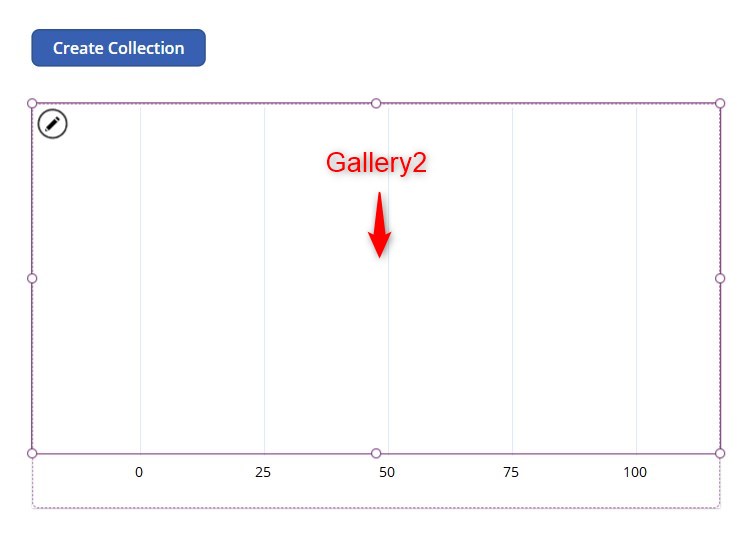
Step 7:
Insert a blank vertical gallery named Gallery2 inside Container1. Change the following properties:
X property
0Y property
0Width property
Container1.WidthHeight property
437TemplateSize property
88Items property
collMyCollection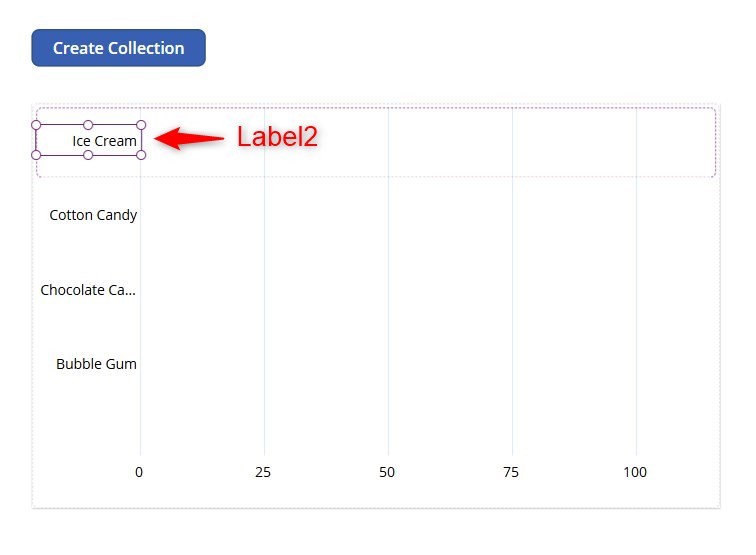
Step 8:
Insert a text label named Label2 inside Gallery2. Change the following properties:
X property
0Y property
22Width property
131Height property
37Wrap property
falseAlign property
Align.RightText property
ThisItem.Title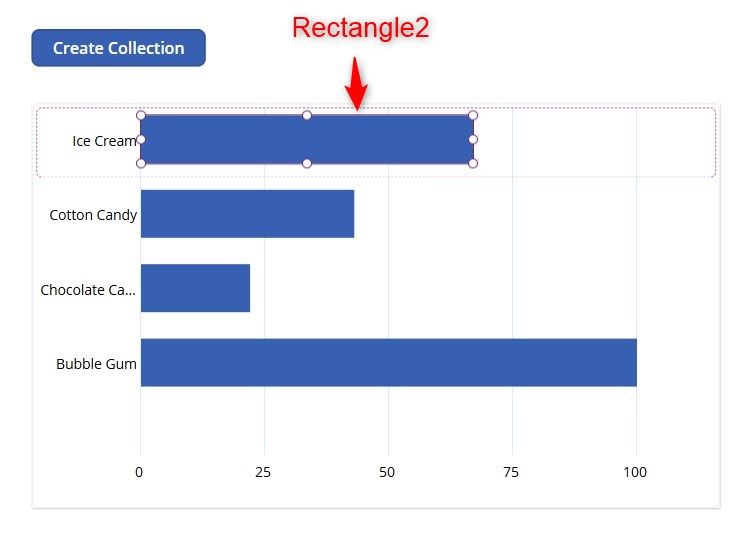
Step 9:
Insert a rectangle named Rectangle2 inside Gallery2. Change the following properties:
X property
131Y property
10Width property
With({varGalleryWidthMinusInitialSpace:Gallery1.Width - 184},
varGalleryWidthMinusInitialSpace -
((1-(IfError(ThisItem.Count/Max(collMyCollection,Count),1)))
*varGalleryWidthMinusInitialSpace)
)
Height property
60HoverFill property
ColorFade(Self.Fill,20%)Tooltip property
ThisItem.Title & " - " & ThisItem.Count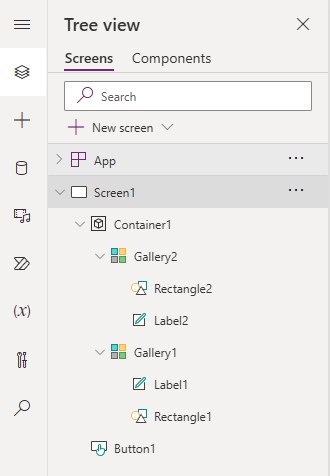
Review:
As of the last step, your tree view must look similar to the one in the image.

Conclusion:
Once you have finished the last step, you have now a simple horizontal bar chart. Replace the collection named collMyCollection into your own collection/data. Keep in mind that you may need to replace some text inside the formulas based on the column names of your collection.
Did this article help? Let us know how we can improve. Send us a message by clicking the “Contact Us” button below.
Article last updated on June 20, 2024
Need expert guidance on Power Apps?